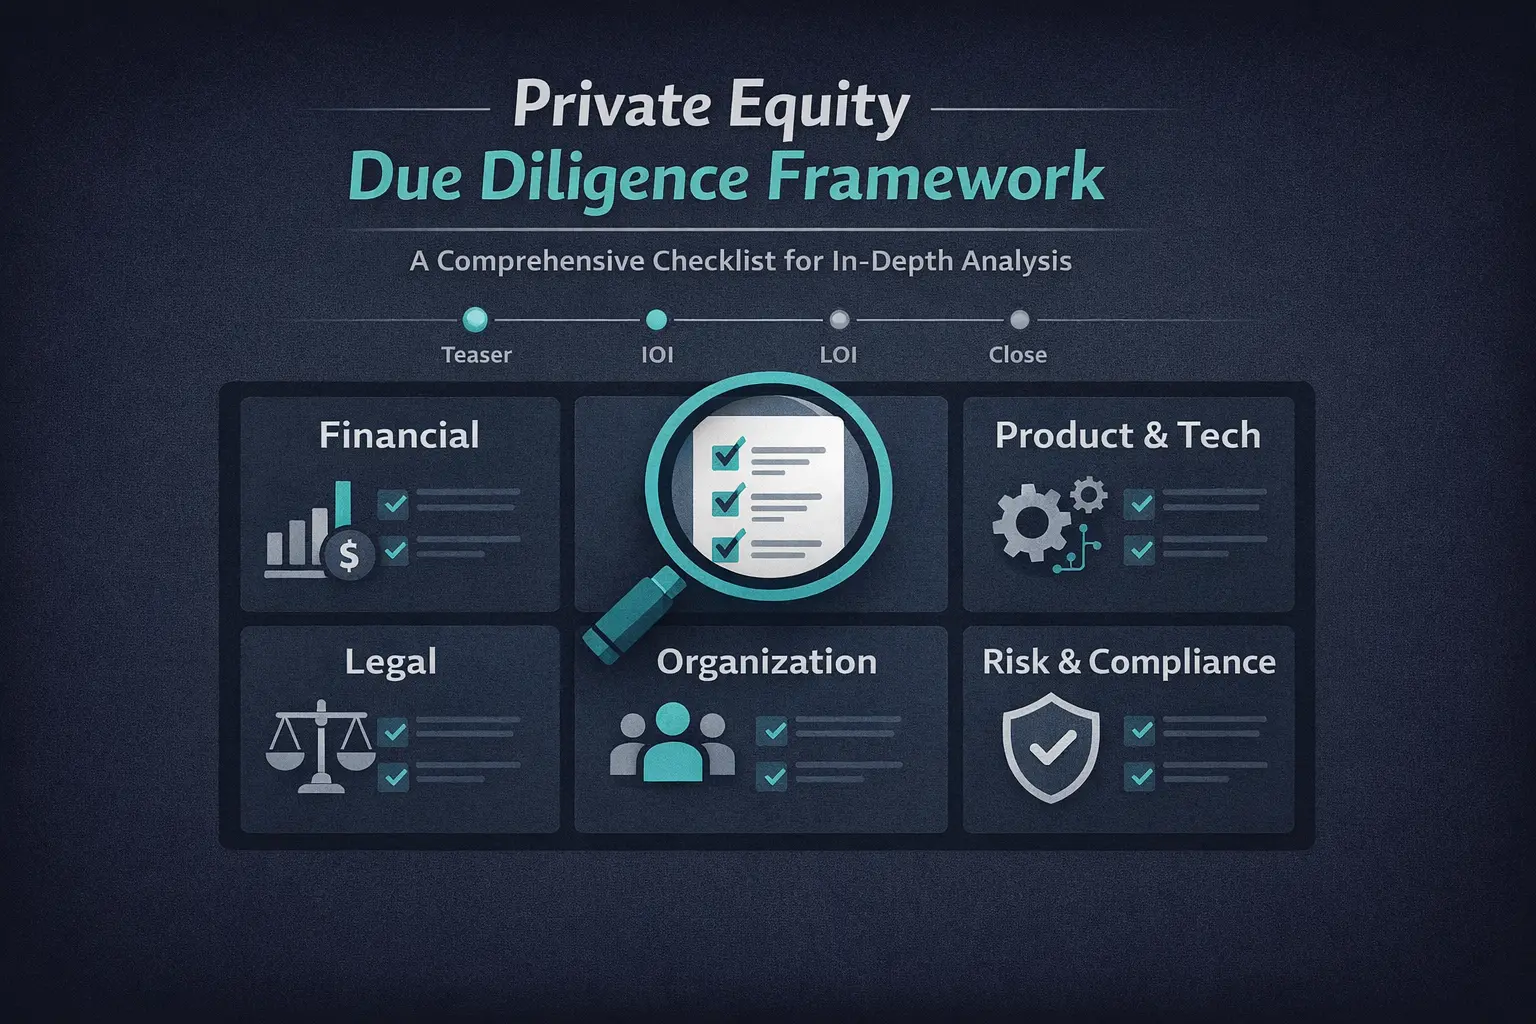
Private Equity Due Diligence Framework: Commercial Analysis in 6 Steps
Written for private equity analysts, associates, and investment committee members conducting commercial due diligence on software acquisitions.
Why Commercial Diligence Deserves More Time Than It Usually Gets
In most PE deal processes, commercial due diligence gets squeezed between financial model completion and IC submission. Teams run the numbers, build the deck, and treat competitive intelligence as a checkbox. Then post-close, they discover the market positioning was softer than the CIM suggested, the customer concentration was worse than the data room revealed, and the competitive moat was narrower than the management presentation claimed.
This is not a new problem. But in software markets where product cycles compress and competitors emerge faster than anticipated, the cost of shallow commercial diligence has increased. This framework organizes commercial due diligence into six workstreams that collectively give investment teams a defensible view of growth sustainability, competitive positioning, and integration risk before they own the asset.
For a comprehensive checklist covering all diligence phases, explore the private equity due diligence checklist.
1. Market Sizing and Growth Validation
Before modeling revenue expansion, validate that the TAM, SAM, and SOM figures in the CIM are defensible.
What to pressure-test:
- Bottom-up segmentation: Does the SAM calculation reflect actual buyer segments the target serves, or does it assume universal addressability?
- Historical growth drivers: Is revenue growth a result of market expansion, market share gains, or simply adding similar customers at the same rate? Each driver has different sustainability implications.
- Win/loss data: If available, analyze win/loss records to understand where the target is gaining share and where it's losing. A pattern of losing deals to lower-cost alternatives signals pricing pressure ahead.
Key question for IC: Does the growth thesis assume continued market expansion, or does it require sustained share gains against increasingly well-funded competitors?
2. Competitive Landscape Mapping
Seller-provided competitor lists are curated narrative devices. A rigorous competitive map includes direct competitors, adjacent solutions, latent substitutes, and legacy incumbents that customers haven't fully abandoned.
What to pressure-test:
- Completeness: How many competitors does the target's list omit? Automated competitive discovery tools can surface 3-5x the competitors in a manual search. Missing serious competitors distorts win-rate assumptions and TAM allocation.
- Positioning accuracy: Does the target claim a specific market segment or use case as its primary differentiation? Validate this against customer review data and win/loss records.
- Feature parity depth: In contested markets, most competitors claim similar feature sets. Harvey Balls scoring with evidence tiers separates genuine depth from marketing parity. See the Commercial Diligence Harvey Balls Framework for scoring rigor.
Key question for IC: Is the competitive set tightening or loosening? Are new entrants emerging from adjacent categories with different cost structures?
3. Customer Quality and Concentration Analysis
Revenue quality assessment identifies durability, concentration risk, and expansion potential before they become post-close surprises.
What to pressure-test:
- Cohort retention: Do gross revenue retention rates vary meaningfully across customer cohorts? Declining retention in older cohorts signals product-market fit erosion.
- Net revenue retention drivers: Is NRR driven by genuine expansion, or by pricing increases applied uniformly to captive customers?
- Concentration: A customer representing more than 10% of revenue is a deal risk factor unless that customer's success is structurally tied to the product (mutual dependency, high switching costs, contractual lock-in).
- Customer segment diversity: Revenue concentration across a single customer segment, geography, or use case increases exposure to sector-specific downturns.
Key question for IC: If the top 3 customers left simultaneously, what does revenue look like? Does the model stress-test this scenario?
4. Pricing Architecture and Expansion Levers
Pricing analysis reveals both revenue expansion potential and competitive vulnerability.
What to pressure-test:
- Price positioning vs. competitors: Where does the target sit on the price/quality curve relative to named competitors? Automated pricing analysis can construct this positioning in minutes rather than days of manual research.
- Packaging structure: Is pricing seat-based, consumption-based, or tiered by feature? Each model has different expansion implications and competitive exposure.
- Historical price increases: Have annual price increases been accepted by customers without pushback? Unchallenged price increases suggest pricing power; they also signal potential vulnerability if a well-funded competitor enters with a disruptive lower price.
- Contract terms: Average contract length and auto-renewal terms affect revenue predictability and competitive switching risk.
For pricing analysis workflows, see pricing architecture decoding for due diligence.
Key question for IC: What is the realistic annual pricing leverage available without triggering competitive displacement or customer churn?
5. Go-to-Market Effectiveness
GTM validation tests whether the target's customer acquisition model is repeatable and scalable at the growth rate embedded in the valuation.
What to pressure-test:
- CAC payback trajectory: Is CAC payback improving, flat, or deteriorating across cohorts? Deteriorating payback in newer cohorts often signals increased competitive pressure or market saturation.
- Channel mix: Direct sales, partner channels, and product-led growth each have different scalability constraints. A target heavily reliant on founder-led sales faces a ceiling without investment in sales capacity.
- Sales cycle length: Are sales cycles elongating? Longer cycles in B2B software often signal increased buyer deliberation, more competitors in evaluation, or declining urgency.
- Churn and contraction analysis: Separate customer losses from downgrades to understand whether churn is driven by product-market fit issues or by deliberate customer portfolio management.
Key question for IC: Does the sales capacity plan support the growth target? What headcount additions are required and at what cost?
6. Product Depth and Competitive Moat
Product due diligence assesses whether the technology stack and feature development velocity support the growth thesis.
What to pressure-test:
- Core differentiators: What features or integrations are genuinely difficult for competitors to replicate? Look for depth indicators: configuration complexity, integration stickiness, workflow data network effects.
- Development velocity: How many meaningful features ship per quarter? Declining velocity in a fast-moving market signals execution risk.
- Technical debt indicators: High technical debt often appears as slow feature delivery, frequent outages, or excessive engineering time spent on maintenance versus new development.
- Roadmap realism: Compare the product roadmap to actual delivery velocity. Ambitious roadmaps without corresponding execution suggest either over-commitment or lack of technical capacity.
For a structured approach to capability scoring across competitors, see the Harvey Balls scoring framework.
Key question for IC: What is the minimum investment required to maintain competitive positioning over the hold period, and does the model account for this?
Sequencing the Workstreams
These six workstreams are not independent. Market sizing informs competitive positioning; competitive positioning affects pricing power; pricing power influences GTM efficiency; GTM efficiency shows up in customer cohort quality.
The practical sequencing:
- Week 1: Market sizing and competitive landscape mapping run in parallel. These set the analytical foundation for everything else.
- Week 2: Customer quality analysis and pricing architecture. These require data room access and customer reference calls.
- Week 3: GTM effectiveness and product depth. These require management meetings, technical architecture reviews, and sales pipeline analysis.
Connecting Diligence Findings to Valuation
Each workstream should output a finding that directly connects to a model assumption:
- Market sizing → TAM/SAM assumptions and market growth rate
- Competitive positioning → Win rates, pricing leverage, and competitive displacement risk
- Customer quality → Revenue retention assumptions and NRR ceiling
- Pricing architecture → Realizable pricing increases and expansion revenue
- GTM effectiveness → Customer acquisition cost trajectory and sales capacity requirements
- Product depth → Maintenance capex and R&D efficiency assumptions
When diligence findings map directly to model drivers, IC discussions focus on judgment calls rather than data compilation. The goal is informed conviction, not complete certainty.
Streamline your commercial due diligence: Explore SuiteCompete's competitive intelligence tools at SuiteCompete.com for automated competitor discovery, pricing analysis, and feature comparison workflows.